Commercial dashboards and operational overview analytics for revenue teams
Use overview surfaces built for revenue and pipeline insight across accounts, products, order funnel, product movement, and commercial status.
Product map
Commercial dashboards
Product map
Commercial dashboards
Visibility layer
Commercial dashboards give teams a shared operating view of revenue and pipeline across accounts, products, price books, and offer stages without leaving the platform to reconstruct the picture elsewhere.
Feature
Commercial dashboards
Built for teams that want pipeline and revenue visibility to sit next to the workflow, not in a disconnected reporting layer.
[/1] KPI surface
Live
Tiles across accounts, products, and commercial statuses show the core operating state in one place.
[/2] Pipeline view
Composed
Revenue trajectory and funnel composition reveal how current work is distributed across stages and commercial themes.
[/3] Charting
Native
Native charts, gauges, and reusable components bring operational focus to product movement and status changes.
Dashboards that help teams operate, not only report
The strongest analytics surface today is the operational overview layer, where teams can move from visibility to action without context switching.
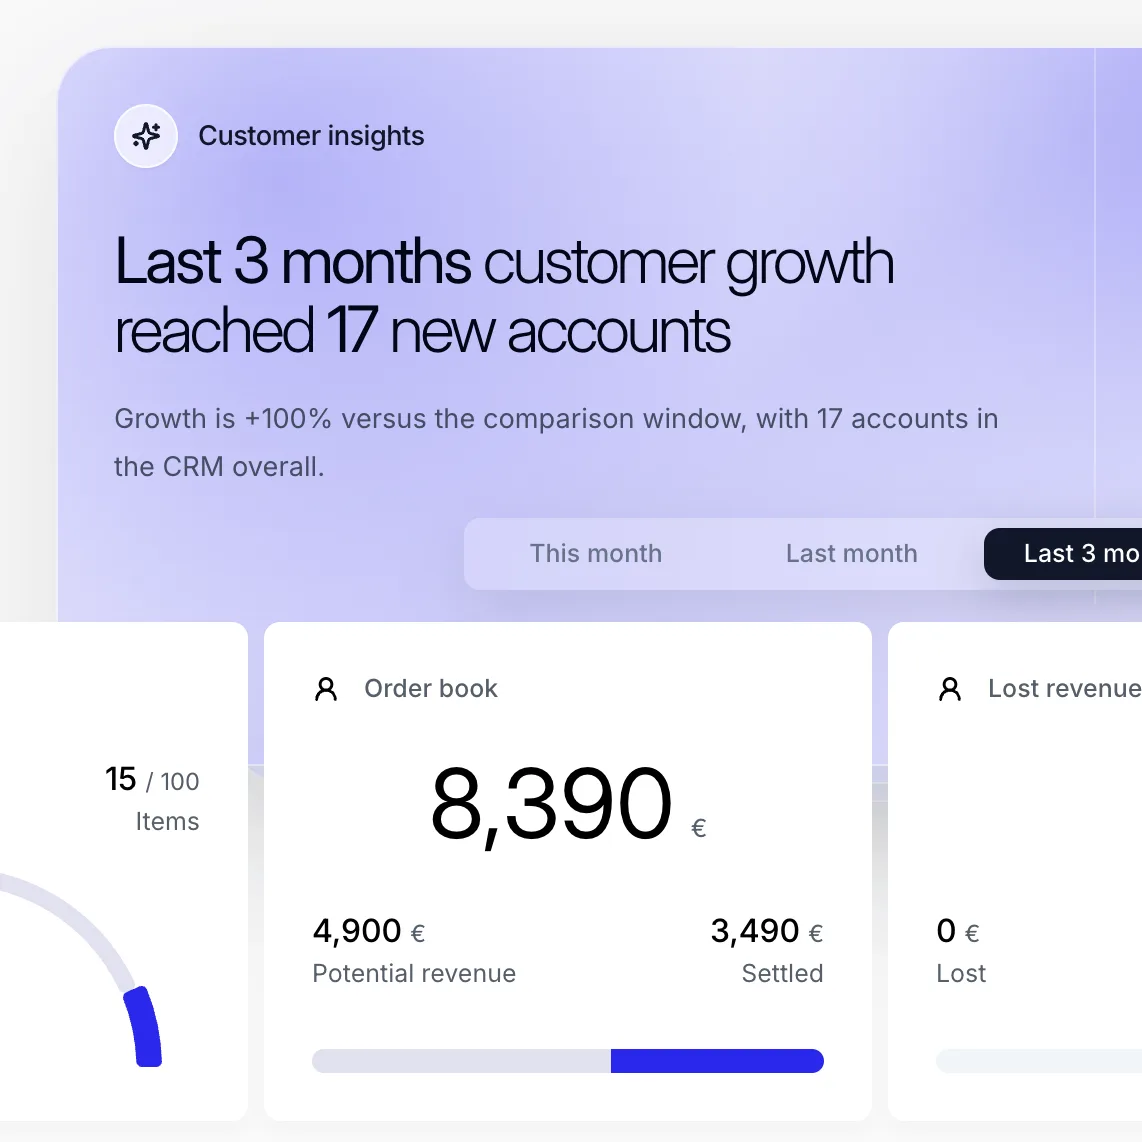
Commercial dashboards in Reforce show KPI tiles, order funnel analysis, revenue trajectory, account growth, product movement, and commercial status summaries directly inside the same workspace used to run the workflow.
The strongest analytics surface today is the operational overview layer, supported by native charting for funnel views, stacked comparisons, trajectory charts, gauges, and reusable components across overview and order reporting.
KPI tiles across commercial objects
Revenue trajectory, funnel, and status summaries
Reusable native chart components
Product movement tied to live workflow state
See it in action
Make commercial structure easier to launch
Use Reforce to connect catalogs, configuration, pricing, and customer execution in one workflow teams can actually trust.